Technician Pipeline
Technician Shortage 2026: Board-Level Risk & Workforce Strategy
Technician shortage impacts revenue through production delays and downtime. Learn the financial impact, scenario modeling, and workforce strategies to close the gap.
July 22, 2026

.svg)
Key Takeaways
- The technician shortage directly reduces operational output and accelerates unplanned downtime, creating measurable bottom-line impact tied to days of lost production per year.
- Cost-of-vacancy for technician roles often exceeds 1.5x annual salary when you account for lost productivity and equipment idle time during vacancies.
- Competitive technician-to-operator ratios vary widely across the sector. Leaders outpace peers by investing in credentialing pipelines rather than hiring volume alone.
- Scenario modeling reveals that a 10 percent deepening of local technician shortage could compress your production schedule by 2 to 4 weeks, with cascading customer delivery impact.
- Using workforce valuation intelligence, your operations team can track completion-to-hire conversion and identify supply gaps 6 to 12 weeks earlier than traditional metrics allow.
Are you losing production revenue because technician positions stay vacant for months? Does your operational team struggle when equipment runs past maintenance windows because qualified technicians aren't available?
What is the technician shortage? It's a structural imbalance between demand for skilled technicians and available supply. Technician roles require industry-specific certifications and extended training. Retirement waves, compressed trade school enrollment, and persistent production demand have widened the gap significantly. For manufacturers and utilities, this shortage is a material operational risk affecting revenue and competitive position.
The technician shortage in 2026 isn't a regional staffing blip anymore, it's a material business risk. When production lines sit idle, customers face delays and better-staffed competitors pull ahead. For boards, the conversation has shifted from "How do we hire fast?" to "What does a deeper shortage cost us, and how do we measure it?"
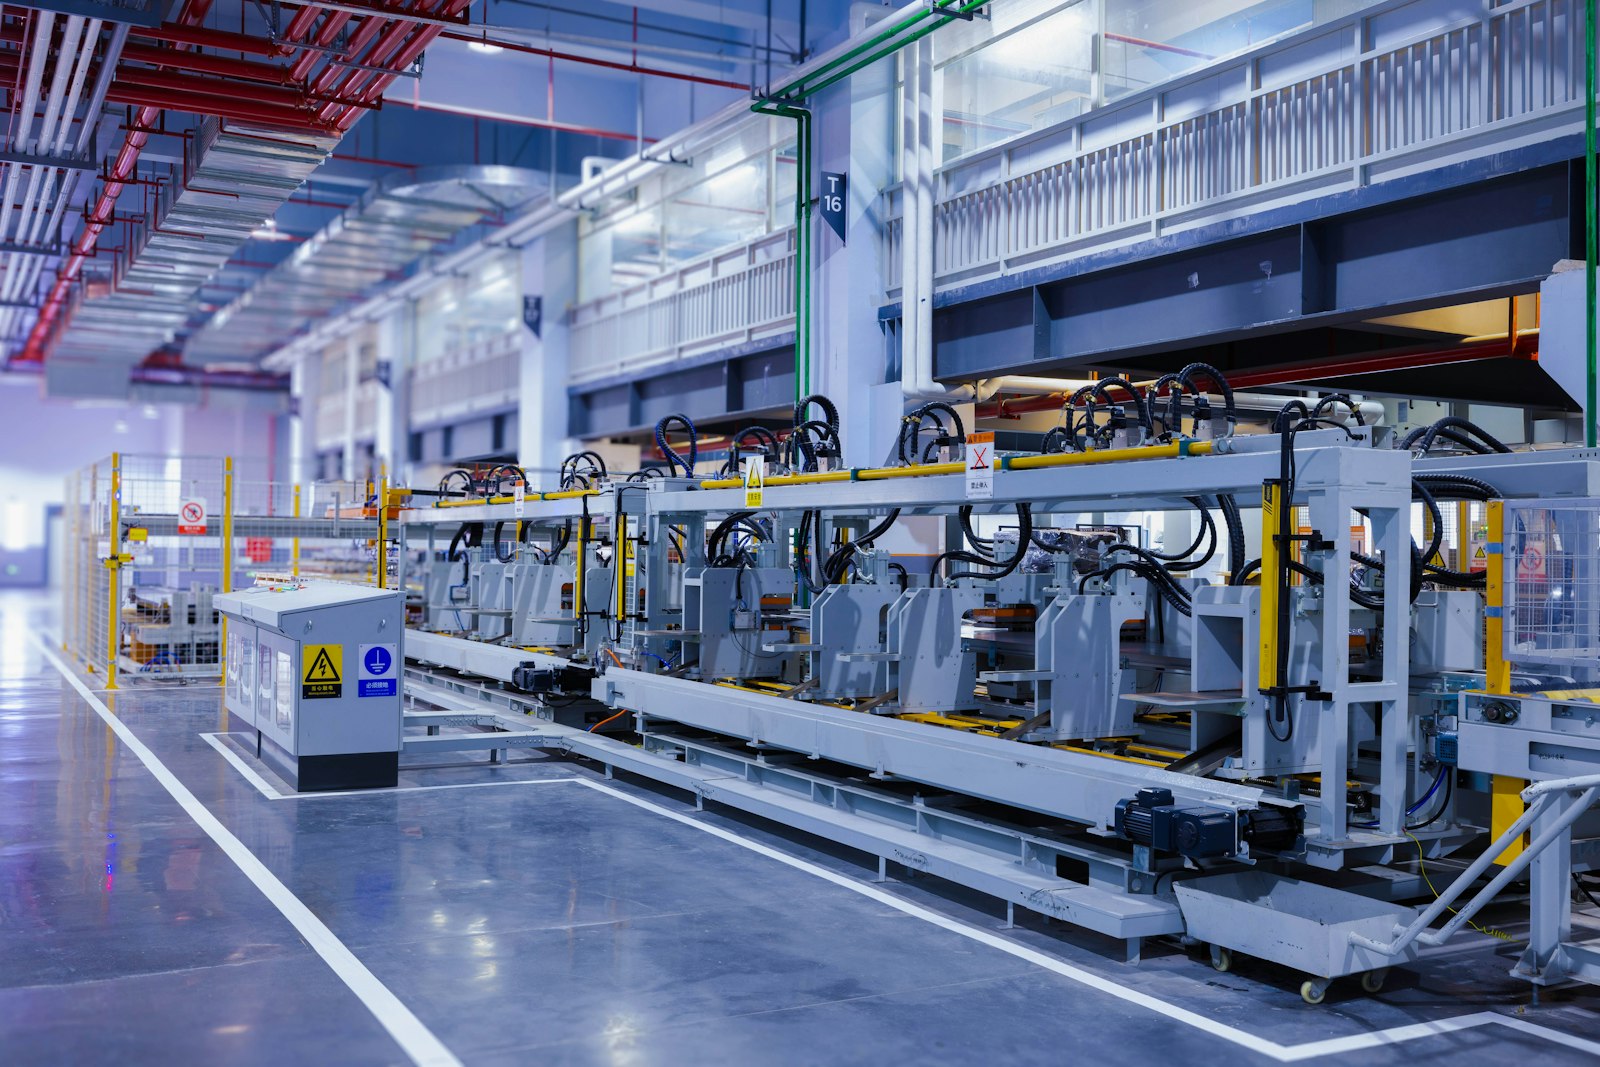
Walk through a manufacturing facility or utility site today and you'll see the strain. HVAC systems need maintenance. Equipment with PLC controls (programmable logic controllers that manage industrial processes) requires troubleshooting. Machinery runs past optimal maintenance intervals because there simply aren't enough hands to service it all. The shortage isn't about entry-level roles; it's about credentialed technicians who can diagnose and repair six-figure equipment. This article frames technician capacity as an investable asset class. We'll walk through the financial impact, scenario modeling, and competitive intelligence so you can assess your organization's technician supply risk and ROI on workforce resilience strategies.
The 2026 Technician Shortage: Scope, Severity & Board-Level Risk
The technician shortage has moved from scattered regional pockets into a simultaneous structural crisis affecting every industrial sector at once.
Consider what's happening on the ground. According to the Bureau of Labor Statistics Occupational Outlook Handbook, technician roles across industrial maintenance, HVAC, electrical systems, and equipment repair face persistent demand growth through 2034. But supply hasn't kept pace. Retirements accelerated post-2020. Trade school enrollment stalled. Community college technician programs faced funding constraints. Meanwhile, production capacity demands have remained high and in many sectors accelerated.
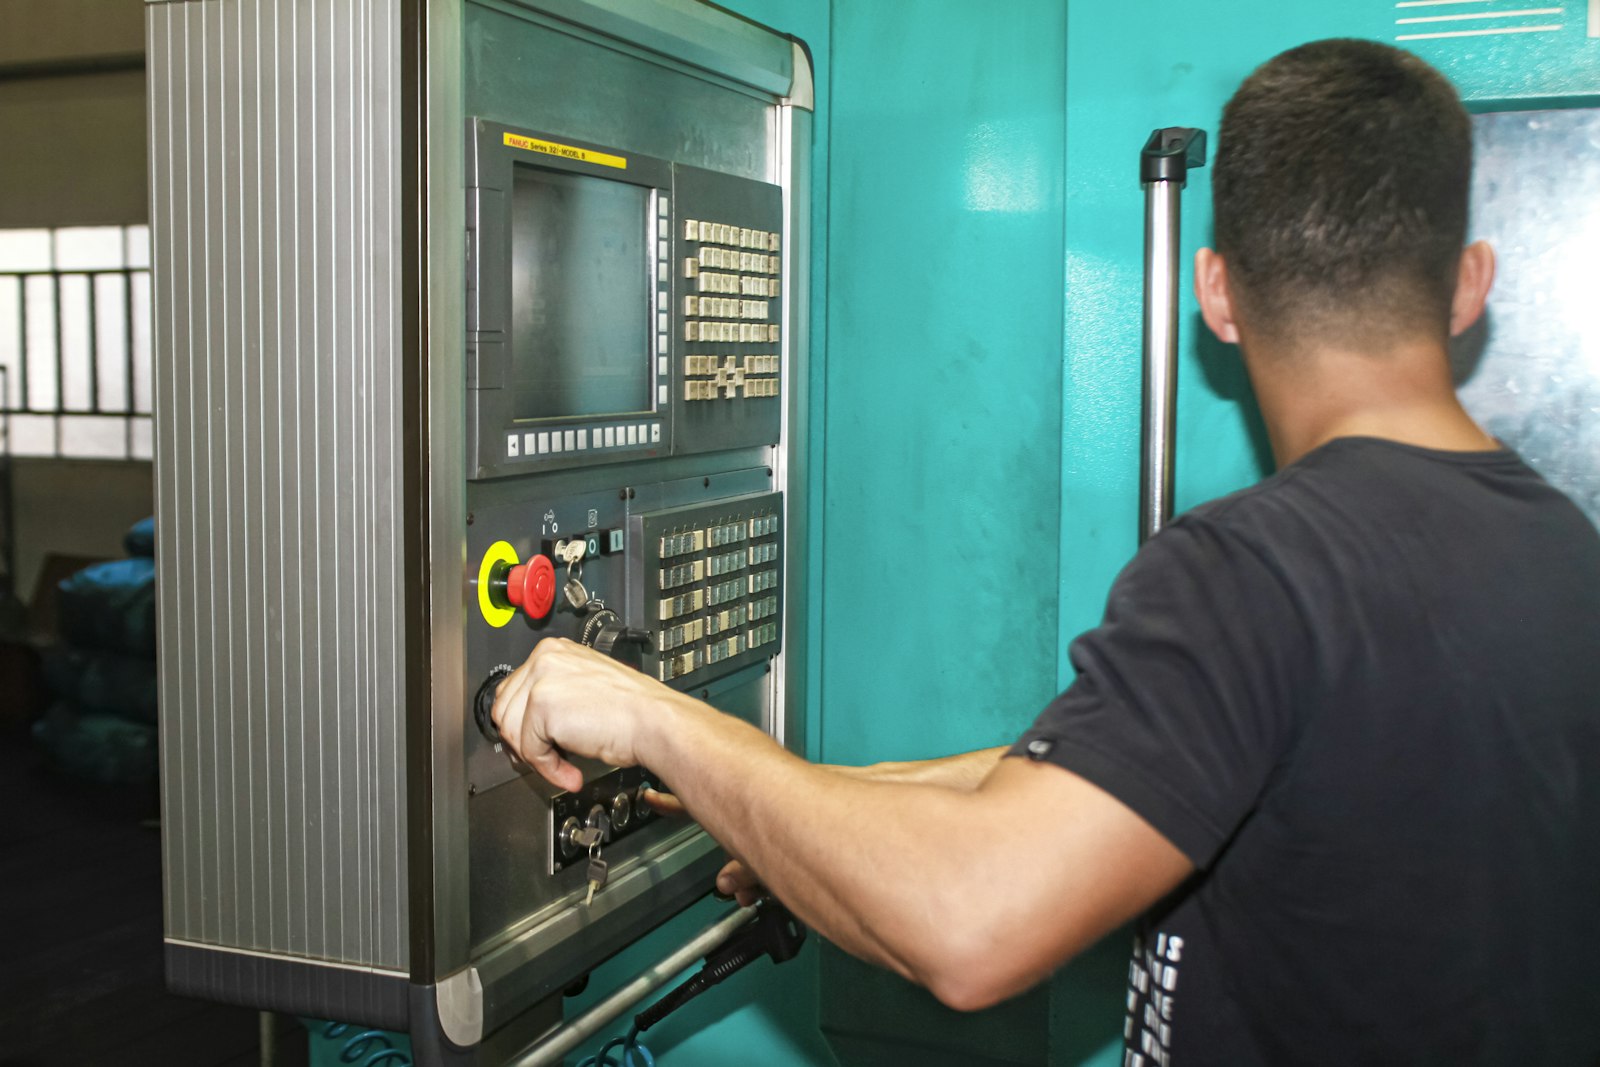
The shortage hits hardest in specialized roles. Maintenance technicians who troubleshoot CNC (Computer Numerical Control) machines, PLC controllers, and hydraulic systems command higher credentials and longer training windows. HVAC technicians certified in refrigerant management (EPA 608 certification) take months to train. Instrumentation technicians with CMRP (Certified Maintenance and Reliability Professional) or ASE credentials are scarce enough that relocation packages are becoming standard in competitive markets.
What makes 2026 different is simultaneity. A shortage in your region isn't offset by pulling talent from adjacent markets anymore. Your competitors face the same local constraints. This forces a harder conversation: instead of asking "How do we outbid peers for limited technicians?" boards now ask "How do we build sustainable technician pipelines and what's our fallback if shortage deepens?"
For boards, the stakes are operational continuity. An unfilled technician position cascades through operations. Maintenance windows slip. Equipment reliability degrades. Production schedules compress. Customer commitments tighten. Unplanned downtime caused by deferred maintenance can cost high-volume manufacturers tens of thousands of dollars per day. Technicians of America tracks regional technician demand and wage visibility to help organizations understand their local talent landscape and competitive positioning.
The shortage is real and measurable. Its severity depends on your sector, geography, and whether you've invested in forward-looking talent strategies. That's where workforce intelligence becomes critical to board-level decision-making.
Financial Impact: Where the Shortage Hits Your Bottom Line
One unfilled technician position doesn't just create a hiring gap. It compounds across production schedules, equipment reliability, customer commitments, and competitive position.
Start with cost-of-vacancy. The standard HR calculation, salary plus burden rate, captures only a fraction of the true cost. A maintenance technician earning $65,000 annually might seem like a $100,000 total-cost position. But the cost-of-vacancy is higher. When a technician role sits unfilled for three months, the business doesn't save $25,000. Instead, remaining technicians work overtime (burnout and safety risk). Equipment maintenance defers (bigger failures downstream). Production schedules slip (customer and reputation risk). Competitors with full technician rosters gain market share.
The calculation is compelling. A $100,000 technician role vacant for six months can cost the organization $150,000 to $250,000 in lost productivity, deferred maintenance cascades, and delayed revenue. That math changes the investment calculus around recruitment, training partnerships, and retention, which costs far less than vacancy or turnover.
Beyond vacancy costs, technician shortages ripple into operational risk. Predictive maintenance programs (structured approaches that identify equipment drift before failure) reduce catastrophic equipment failure by 50 percent or more. But these programs require technician hours. When technicians are stretched thin, preventive work gets deferred. Organizations shift into reactive maintenance mode. Breakdowns become emergency calls. Emergency repairs cost 2 to 3 times more than planned maintenance and create production disruption cascading across customer commitments.
Then there's competitive disadvantage. If your competitor has a 10 percent staffing advantage in technicians, they deploy preventive-maintenance tools like CMMS (computerized maintenance management systems that track work orders and equipment history). They catch equipment drift before failure. Your organization stays in reactive mode. Their equipment uptime runs 5 to 10 percent higher. Over a year, that's a significant market-share difference. Risk also accumulates on the ESG front. Deferred maintenance creates safety exposure. Stretched technicians work longer hours, increasing fatigue-related errors. Shortages that force hiring less-qualified workers introduce quality and safety variance. These factors create liability, regulatory exposure, and stakeholder risk that boards now scrutinize heavily.
Scenario Planning: How Shortage Intensification Affects Your Bottom Line
Board-level risk assessment requires scenario modeling. What happens to your operation if technician shortage deepens? This isn't pessimism, it's fiduciary responsibility.
Scenario A: Modest Deepening (10% local technician shortage)
Your region loses 10 percent of available technician labor through retirement, regional outmigration, or training-pipeline compression. Your organization, currently running at 95 percent technician staffing capacity, drops to 85 percent. Production schedule compresses by 1 to 2 weeks. Preventive maintenance program shifts partially to reactive mode. Equipment uptime declines 2 to 4 percent. Customer delivery dates slip. Cost impact: equivalent to 2 to 6 weeks of foregone revenue, plus customer retention risk.
Scenario B: Significant Deepening (20% local technician shortage)
Your region loses 20 percent of technician supply. Retirement waves and training-pipeline compression compound. Your organization drops to 75 percent staffing. Production schedule compresses by 3 to 4 weeks. Preventive maintenance halts entirely, and the organization runs in full reactive mode. Equipment reliability drops visibly. Customer commitments face real strain. You're likely losing competitive bids to better-staffed competitors. Cost impact: equivalent to 4 to 12 weeks of foregone revenue, plus measurable customer churn.
Scenario C: Crisis (30% or greater shortage)
A regional crisis pulls 30 percent of local technician talent through economic shock, major employer closure, or accelerated retirements. Your organization faces existential operational constraint. You cannot run current production schedules or staff 24/7 operations. Significant customer contract losses follow. Production must be curtailed or customer base pruned. Capital redeployment likely becomes necessary. Cost impact: material to strategic.
Which scenario applies to your organization? That depends on your technician retention rate, your training-pipeline investment, your regional talent market, and your competitive positioning. Modeling these scenarios with your operations team isn't theoretical, it's foundational risk management for board-level governance.

Workforce Resilience Strategies: Mitigation Options & Investment ROI
The most effective mitigation combines three levers: upskilling internal staff, accelerating entry-level technician credentialing, and optimizing retention through clear career pathways and transparent pay equity.
Lever 1: Internal Upskilling
Many manufacturers underutilize a hidden talent pool: experienced production operators who have the mechanical aptitude and work ethic to become technicians but lack formal credentials. Upskilling operators into technician roles has clear advantages. They know your equipment, culture, and operations. Training timeline is shorter because foundational knowledge exists. The ROI calculation: if you convert one operator per year into a technician through structured upskilling, you're adding 0.5 to 1 percent to your technician headcount organically. Over five years, that's 5 to 10 percent capacity growth without external hiring pressure. Upskilling programs that pair on-the-job training with formal credentials (MSSC CPT, NCCER, or equivalent) create retention because the employee sees career progression clearly.
Lever 2: Entry-Level Credentialing Partnerships
Accelerating entry-level technician pipelines requires partnership with training providers who move candidates from zero credentials to job-ready in months, not years. Unmudl's Multi-Craft Technician Level 1 course targets operators and early-career technicians looking to stack credentials quickly. Community college programs offer traditional approaches, but new fast-path models compress that timeline significantly.
The advantage of short-form credentials over traditional degree programs is velocity. A 12-week certification that moves candidates closer to NCCER compliance or employer-specific competency is faster than 2-year enrollment. ROI for employers is higher because time-to-productivity is weeks, not years. When you hire from a fast-track pipeline, the technician contributes revenue within 8 to 12 weeks. With traditional graduates, ROI takes longer to materialize. Organizations investing in these pathways report 20 to 40 percent faster hiring and 15 to 25 percent higher first-year retention.
Lever 3: Retention Through Visibility and Career Progression
The costliest technician problem isn't hiring, it's turnover. A technician trained at cost to your organization who leaves costs you the entire upskilling investment plus lost institutional knowledge.
Retention strategy has three components. First, transparency: technicians need to see where their roles lead. Is there a path from maintenance technician to lead technician to operations supervisor? Second, recognition: technicians should have visibility into wage benchmarks and progression timelines. Technicians of America provides wage and pathway visibility so your workforce understands market compensation and advancement. Third, career development: opportunities to pursue certifications (CMRP, ASE, NATE) should be supported because the technician invests in their own credentials and your organization benefits from upskilled labor. Organizations with structured retention programs see technician tenure extend by 50 percent or more, which directly translates to reduced vacancy costs and higher equipment uptime.
Competitive Intelligence: How Leaders Are Closing the Technician Gap
Manufacturers and utilities that narrowed their technician shortages in 2025 and 2026 share one trait: they treat technician talent as a capital allocation priority, not a procurement line item.
Here's what they're doing differently. First, they measure. Instead of watching technician headcount as binary (full or unfilled), they track technician portfolio value: completion-to-hire conversion, time-to-productivity, first-year retention, and equipment uptime correlation with staffing levels. These metrics show which parts of their talent strategy work and where to reinvest. Second, they invest early. Rather than waiting until shortage forces emergency hiring, they build relationships with training providers 12 to 24 months in advance. Some negotiate pre-hire agreements with community colleges or fast-path training partners. Others sponsor technician internship programs that create applicant pipelines. Lead time means candidates are job-ready when vacancies open.
Third, they regionalize. National technician markets don't exist. A shortage in automotive manufacturing in Michigan might coincide with adequate supply in food manufacturing in Texas. Leaders understand their regional constraints and either invest regionally or prepare relocation packages where justified. Fourth, they invest in retention. A technician who stays 10 years costs far less than cycling through four 2-year-tenure technicians. Leaders focus on career visibility, certification support, and wage competitiveness. Finally, they use workforce intelligence. Manufacturing America coordinates regional talent coalitions and sector-specific intelligence that helps organizations understand peer technician staffing levels and strategies. This transparency drives better capital allocation decisions and competitive benchmarking.
Organizations that execute on all five levers report technician staffing levels within 5 to 10 percent of full capacity, even in tight regional labor markets. Those executing on only 1 or 2 levers see broader gaps and higher costs.
Board Questions Toolkit: How Should You Be Assessing Technician Supply Risk?
Asking the right questions is the first step to turning technician shortage from a blind spot into a managed risk.
What is your current technician-to-production-asset ratio? Count your technicians. Count your production assets (machines, equipment, vehicles, HVAC systems requiring service). Divide them. Then ask: how does this compare to peer ratio? A 1:50 ratio is common in manufacturing. If you're running 1:75, you have a structural gap affecting production capability.
What is your cost-of-vacancy for unfilled technician roles? Not just salary, but total cost including lost productivity, deferred maintenance, and schedule delays. Organizations that calculate this accurately find vacancy costs run 1.5 to 2.5 times annual salary. This changes the ROI calculus on hiring investment, retention, and training partnerships dramatically.
What percentage of your technicians hold verified certifications? CMRP, ASE, EPA 608, NATE, or NCCER credentials signal quality and create portability. If your percentage is low, certifications are a retention and quality lever you're missing. Certified technicians stay longer and perform better on complex equipment.
What is your time-to-competency for newly hired technicians? How many months from hire date to fully productive on their own? Peer organizations benchmark this at 4 to 8 months depending on role complexity. If you're running 12 months or longer, you have training or onboarding friction to address before shortage deepens.
What is your technician retention rate year-over-year, and why do technicians leave? Exit interviews should categorize departures: higher pay, better benefits, clearer advancement, or other reasons. Fix controllable leaks first. A 10 percent improvement in retention is faster than hiring 10 percent more technicians.
If technician shortage in your region deepened 15 percent, what production-schedule impact should you model? Run the scenario. If the answer is "we don't know," that's a risk gap. If the answer is "we'd lose 3 weeks of production," that's material risk affecting strategy and capital allocation.
See Your Technician Workforce ROI
Organizations that track completion-to-hire conversion and technician portfolio value metrics catch supply-demand misalignment 6 to 12 weeks earlier than traditional hiring metrics allow. Access predictive technician workforce intelligence and assess your risk today.
Take the TPV Health Check →
Frequently Asked Questions
Everything you need to know about getting started, what to expect, and where the opportunities are.
- Manufacturing technicians require specialized knowledge (CNC programming, hydraulic systems, PLC controls) and industry-specific certifications, creating long training windows. Production demands remain high and unforgiving, unlike retail, manufacturing can't easily reduce capacity. The mismatch between demand and supply is acute.
- Use this formula: (monthly salary plus benefits plus overhead) plus (estimated lost productivity per month) plus (customer delivery risk per month) equals monthly cost-of-vacancy. Multiply by expected vacancy duration (typically 3 to 6 months). Organizations that calculate accurately find cost-of-vacancy ranges from $15,000 to $25,000 per month for a technician role. A six-month vacancy costs $90,000 to $150,000 in total impact.
- It's the percentage of people who complete a technician training program and get hired into technician roles within six months. High conversion (70 to 90 percent) signals strong training design and tight labor market alignment. Low conversion (below 50 percent) suggests training isn't meeting employer needs or the labor market is saturated. It's a key metric for assessing training partnership ROI and pipeline quality.
- Yes, significantly. Manufacturing hubs like Michigan, Ohio, and Texas face different shortage intensities than regions without large manufacturing bases. Shortage also depends on recent employer exits or entries, local wage levels relative to cost of living, training-program capacity, and retirement waves. Your local supply constraint differs from a competitor's, requiring localized strategy.
- Upskilling existing operators is usually faster and cheaper. They know your equipment and culture. Training timeline is months, not years. Retention risk is lower because they advance internally. External hiring is necessary when you don't have the operator talent pool to upskill or when rapid scaling requires volume. Best practice: upskill 30 to 50 percent of needs internally, hire externally for the rest.
- Certifications signal job readiness and create portability. A CMRP technician is valued across industries, increasing portability risk but also signaling quality and reducing your training burden. Organizations that sponsor certification programs see 20 to 30 percent higher retention because the technician invests in their own credentials and becomes stickier to the organization.
What Will Your Technician Risk Assessment Look Like?
The board conversation about technician shortage is shifting. Five years ago, the question was tactical: "How do we hire enough technicians?" Today, it's strategic: "What does a deeper shortage cost us, and where should we invest to mitigate this risk?"
That shift requires moving from headcount tracking to asset-class thinking. Technician talent becomes an investable asset with measurable portfolio value, completion-to-hire conversion, and predictive supply-demand signals. See your technician workforce ROI and assess your technician supply risk with TPV-Technicians.